Introduction:
In the realm of machine learning, evaluating the performance of classification models is paramount. Whether you're working on sentiment analysis, medical diagnosis, or image recognition, understanding and choosing the right performance metrics can make the difference between a successful model and an underperforming one. In this comprehensive guide, we'll delve into the world of classification performance metrics, exploring their significance, interpretation, and when to use them.
The Foundation: Confusion Matrix

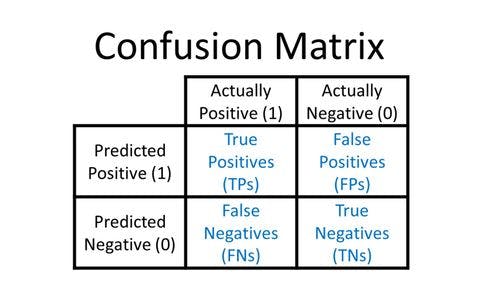
At the heart of classification metrics lies the confusion matrix. It provides a tabular representation of a model's predictions versus the actual class labels. From this matrix, we derive various performance metrics.
Accuracy: A Good Starting Point
Accuracy measures the proportion of correctly classified instances and is calculated as:
\([ \text{Accuracy} = \frac{\text{True Positives} + \text{True Negatives}}{\text{Total Instances}} ]\)
While it's a commonly used metric, it's essential to consider its limitations, especially in imbalanced datasets.
Precision and Recall: Balancing Act
Precision and recall offer a more nuanced view of a model's performance, especially in imbalanced datasets. Precision focuses on minimizing false positives, while recall aims to minimize false negatives.
Precision is calculated as:
\([ \text{Precision} = \frac{\text{True Positives}}{\text{True Positives} + \text{False Positives}} ]\)
Recall is calculated as:
\([ \text{Recall} = \frac{\text{True Positives}}{\text{True Positives} + \text{False Negatives}} ]\)
F1-Score: The Harmonic Mean
The F1 score combines precision and recall into a single metric, providing a balanced measure of a model's accuracy. It's calculated as:
\([ \text{F1-Score} = 2 \times \frac{\text{Precision} \times \text{Recall}}{\text{Precision} + \text{Recall}} ]\)
ROC-AUC: Assessing Discriminative Power
Receiver Operating Characteristic (ROC) and Area Under the Curve (AUC) help evaluate a model's ability to distinguish between classes. ROC is a graphical representation, while AUC is the area under the ROC curve.
Specificity and Sensitivity: Tailing Precision and Recall
Specificity measures the proportion of true negatives correctly classified, and sensitivity measures the proportion of true positives correctly classified. They are calculated as:
\([ \text{Specificity} = \frac{\text{True Negatives}}{\text{True Negatives} + \text{False Positives}} ]\)
\([ \text{Sensitivity} = \frac{\text{True Positives}}{\text{True Positives} + \text{False Negatives}} ]\)
When to Use Which Metric?
The choice of performance metric depends on the problem domain, the cost of false positives and false negatives, and the data distribution. Consider the specific context and objectives of your project to select the most appropriate metric.
Conclusion
Evaluating the performance of classification models is a critical step in the machine learning workflow. Armed with a thorough understanding of performance metrics and their formulas, you can make informed decisions, fine-tune your models, and deliver solutions that meet your project's objectives. This guide equips you with the knowledge and insights needed to navigate the rich landscape of classification performance evaluation effectively.